The first cyclone over Portugal
Cyclone over Portugal
Mystery surrounding Cyclone Rita
**
Source of the first document ** :
http://www.lameteo.org/meteo-8.html
Reported by Frédéric Baudemont.
Tuesday, October 11, 2005
Here is an event that went almost unnoticed amidst the flood of international news (flood is, in this case, a well-chosen word).
Cyclones form over warm waters and in principle when these reach a threshold temperature of 26°C. In mid-October 2005, a tropical-type cyclone, whose intensity (level 1) is obviously not comparable to that of the two cyclones that struck the southern United States, formed in the middle of the Atlantic on October 9 and reached Portugal on the 11th. It resulted only in violent winds and very heavy rains.
Let us first look at the temperature curves corresponding to October 14, 2005:
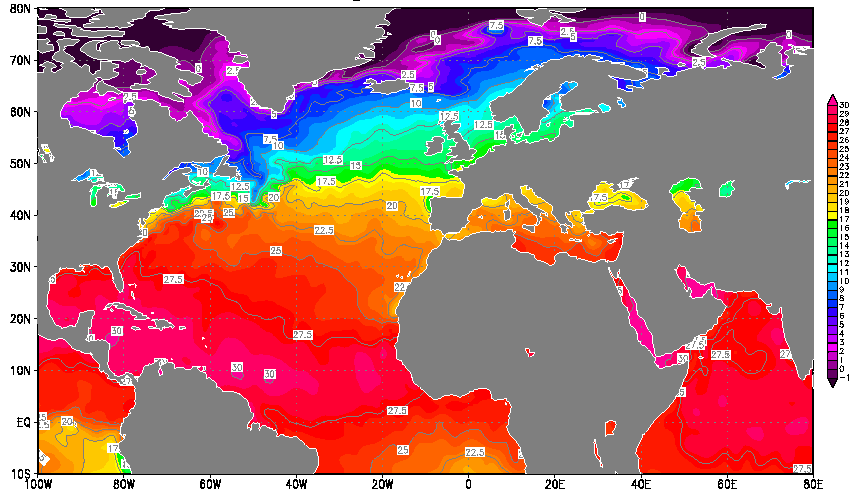
We see that the 26° isotherm is located several thousand kilometers from Portugal. Below is a closer image of the meteorological situation on this day, October 14, 2005.
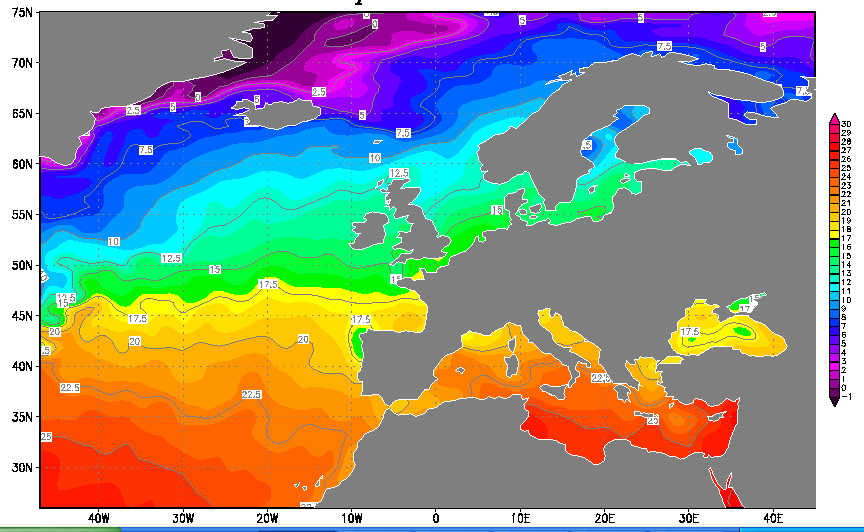
Distribution of ocean temperatures west of Europe on October 14, 2005
On Saturday, October 9, against all expectations, an authentic cyclone formed in the middle of the Atlantic, heading towards Portugal. The "eye" is clearly visible.
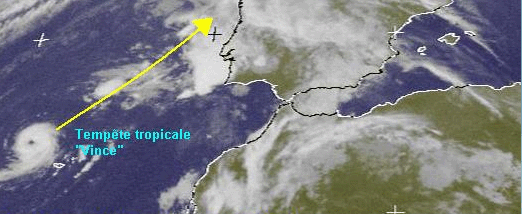
Cyclone Vince, October 9, 2005
Vince formed northwest of Madeira, between the Azores and the Canary Islands. In the image above, the speed of the swirling winds is 120 km/h with gusts up to 140 km/h. This is the first time in the history of modern meteorology (since 1851) that a tropical phenomenon has formed so close to the European continent. Europe is sometimes hit by sub-tropical storms that formed in the southern Atlantic Ocean or towards the Gulf of Mexico, as in 1993 or 1995. According to historical archives, no tropical cyclone has ever reached land on the Iberian Peninsula. Hurricanes and tropical storms generally form in warm waters located much further south than the small Portuguese archipelago of Madeira, which is located about 2,000 km southwest of Portugal. Moving at 10 km/h, the cyclone moved north towards Portugal.
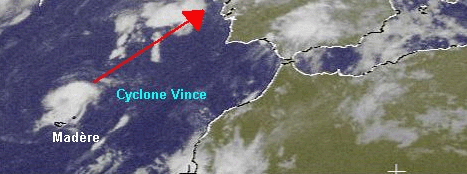
Vince on October 10, 2005
A 3-megabyte animation showing the formation and dissipation of Vince.
Is our climate undergoing profound change? If we judge simply by the melting of glaciers, it is obvious. We are in the midst of a global warming phase. But what is the cause? The greenhouse effect obviously does not help matters. But if we were to completely curb this cause, would that be enough to stop the phenomenon? It is not certain. There is a phenomenon that we do not currently know how to assess well: it is the effect of the renewed solar activity. The Sun experienced last August its strongest solar eruption since we have been able to observe these surges. The bombardment of the Earth's upper atmosphere by high-energy particles emitted during this eruption (the cause of this phenomenon) modifies the Earth's albedo, the atmosphere's ability to reflect the energy sent to it by the Sun.
Finally, there are other causes, which cannot be ruled out a priori, although they seem to belong to science fiction. These could be experiments with climate weapons.
A strange formation, west of "Rita"
October 16, 2005
I manage what I am sent each day with difficulty. The material is always too abundant. My pile of messages grows at an impressive rate. I receive 200 per day. I try to handle what I consider priorities. Readers sometimes wonder, "Why didn't he report on the documentation I sent him?" Probably because that message, those attachments, sink rapidly to the bottom of the pile constituted by hundreds of emails.

When one considers the hallucinating chain of natural disasters occurring for months: cyclones, earthquakes, tsunamis, threat of .. pandemic, one is tempted to ask the question: could these things be signs of human intervention, or would considering these things from this angle amount to paranoia?
When I have found the time to do so, I will present to you all that we have regarding the events of September 11, 2001. It is up to you to form your own opinion, to build your own conclusion, based on what is provided to you, that is to say, on one hand the counter-investigation carried out by Jimmy Walter's team, a group of fearless Americans, and on the other hand, the arguments of those who support the official thesis. It is not a matter of stuffing your heads. It is a matter of putting elements for reflection at your disposal. The champions of the official thesis stretch arguments that sometimes border on the ridiculous. On one site, for example, one can read: "The proof that a Boeing 757 did hit the Pentagon is that the diameter of the hole in the facade is equal to that of the aircraft's fuselage." What seems extremely serious to us is that the television channel most actively engaged in this campaign is the Franco-German channel ARTE, which strove, by revealing to us "everything about the CIA's wars" etc..., to build an image of courageous and uncompromising journalism. Yet this channel produced not one but two documents back-to-back in 2004. The first, which is a true disgrace to the journalistic profession, is titled "September 11 Did Not Happen." The second, from which one of my readers is currently extracting a sequence demonstrating the manipulation of information, bears a title that escapes me for the moment. The document is presented by a journalist from the German branch of Arte but was made in the United States. In it, one hears the very designer of the Twin Towers confessing and explaining why these two giants of Manhattan collapsed an hour after being hit by planes. A design error, he confesses, which now "prevents him from sleeping." I will show, by analyzing this document, that the arguments do not hold up. The man attributes this collapse to the "buckling" of the buildings' load-bearing structure, essentially an external shell, evoking a sort of "cage." What is fantastic is that the demonstration he offers us, in the form of a model he loads before our eyes, demonstrates ... the opposite. Under these conditions, the two towers could never have collapsed vertically. They would have tilted to the side (which is what ... his model does!). Furthermore, why did Building 7, which had not been hit by a plane and had suffered a rather modest fire, also collapse vertically, in the most "controlled demolition" style, even though its structure was totally different this time. Note that the collapse of this building is not even mentioned in the final report of the US official investigation commission!!!
What a job to go through all this and in particular to extract shorter "digests" from all the documents (those from Arte, covered by copyright, cannot be reproduced in full, although some have considered making them available on Emule). The American film "Painful Deception" is two hours and forty minutes long, which is very long. But I will do it because it is a true duty of information, denouncing the scandalous disinformation maneuvers implemented by Arte.
When one imagines that human beings could be capable of perpetrating what, if a real counter-investigation confirms suspicions already very well supported, would constitute the greatest crime of all time, one is entitled to wonder what could be at work today, or if such questions amount to paranoia, what is now called "conspiracy theories." Sometimes I tend to think:
- Be paranoid and you will be below the truth.
Three thousand dead on September 11. So what? The CIA killed ten times as many to provoke the explosion of conflict with North Vietnam. If you have seen the two-part document (broadcast by the "courageous" channel Arte) titled "The CIA's Wars," you will see one of the directors of this agency, indicted by an investigation commission under the Jimmy Carter administration, answering before the American Senate committee to the question:
- So, you admit that crimes were indeed committed on North Vietnamese territory by infiltrated South Vietnamese, supervised by CIA agents? - Yes - And how many people were killed in these destabilization actions? - Twenty thousand...
Here, we have confessions emerging from the very mouth of the one who ordered these actions, always with the approval of the US Presidency. So, three thousand assassinations on September 11, 2001, why not?
Two hundred sailors delivered to an atrocious agony in August 2000 during the sinking of the Kursk, sacrificed on the altar of state reason. More subtly, hundreds of French soldiers irradiated, due to the cynical indifference of a military power, under the orders of Minister of Armies Messmer, during the campaigns in the Sahara and Mururoa. Yesterday, people spoke of workers killed by asbestos, slowly. One speaks of one hundred thousand victims in total. Yet when these people were contaminated, for example while equipping installations with insulation inside ships, in French shipyards, their management was perfectly aware of the deadly toxicity of the product. What to say about the tens of thousands of young Frenchmen killed in Algeria by French bullets bought by the FLN with money paid to it by the French government, to prevent the pipeline bringing Saharan gas to the port of Bougie from being blown up? Testimony of Delouvrier, General Delegate in Algeria, under the direct orders of de Gaulle, easing his conscience before passing away.
In terms of monstrosities, we have only the embarrassment of choice on Earth. We could unroll pages and pages of them, and new ones appear every day, in a nauseating manner.
Let us return to Rita. A tropical cyclone represents colossal energy. But that sent to us by the Sun is also. One and a half kilowatts per square meter, joules, calories accumulating, hour after hour. I mentioned the fact that by reflecting this energy or, on the contrary, facilitating its absorption, one could theoretically create strong pressure differences between two regions of the globe, and provoke an adjustment in the form of a catastrophic storm. The further apart the points concerned and the longer the maturation time of the process, the more devastating the effect can be. I am convinced that climate weapons can be infinitely more destructive than thermonuclear weapons, mere firecrackers in comparison.
Can one, with simply human means, create a cyclone, an earthquake, a tsunami? No, given the energies involved. But one can trigger a situation that has reached maturity. This, I believe. I explained that the explosion of a strong thermonuclear charge underwater, off the coast of Sumatra, could have been the cause of a phenomenon, a Tsunami that caused the death of 275,000 people, by serving as a trigger. It is not proven, but it remains a technical possibility. In regions where phenomenal tensions have accumulated, such as this Indo-Pakistani border, the underground explosion of a nuclear charge could be largely sufficient to trigger a catastrophe (but where do the Pakistanis conduct this type of test, since we know they have the bomb and developed it, like the Israelis, through underground nuclear experiments?)
One probably cannot create a cyclone from scratch, but one can very probably trigger it, and in any case one can guide it. We all have in mind the images of Cyclone Rita's progression towards the southern United States. These images are not those sent to me by a reader. Others exist, forming an animation. Cyril Leblanc found others for me, from a site:
http://www.enterprisemission.com/weblog/2005/09/hyperdimensional-katrina-scientific.html
(site of Richard Hoegland)
We are confronted with something quite strange, to the west of the cyclone formation. On the animation, one could clearly see these five parallel bands appear, right in the middle of a totally homogeneous zone. Meteorological satellites film across a wide range of wavelengths. In the two images below, the one on the left corresponds to infrared. It seems, therefore, that an overheated zone was artificially created at this location. On the right (GEOS satellite), in the visible spectrum, there is a hole in the cloud cover, which is logical. Hot air absorbs more water vapor.
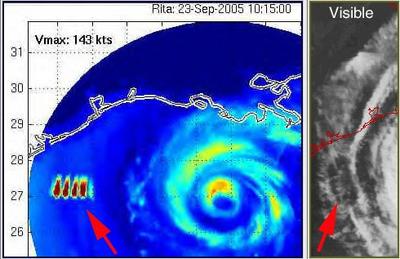
A strange formation, west of Rita. Temperatures are coded blue-green-yellow-red
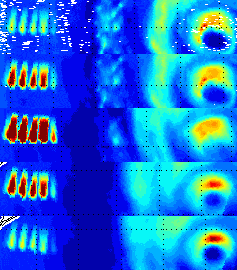
An animated gif showing the evolution of this formation.
Given the perfectly regular appearance of these marks, perfectly unusual, one cannot exclude that it might be a local modification of the pressure field to give a slight push to a monster moving slowly (15 km per hour). It would suffice to solicit the ionosphere with microwave beams, either emitted by a ship or submarine, or emitted by a satellite, or reflected by a mirror of ionized gases. See the file on climate weapons and their operating principle. After these formations appeared, Rita suddenly dropped from category 4 to category 3, bending its course northward, thus sparing Galveston and Houston, as well as all the oil and petrochemical complexes located in this region.
A weak action but, if triggered early, could prove sufficiently effective to ensure, for example, that the city of Houston was spared, which was the case.
Thanks to research conducted by Eric Dezoête, other images of what he calls "The Bear's Claws."
Source: Morphed Integrated Microwave Imagery at CIMSS (MIMIC)
http://cimss.ssec.wisc.edu/tropic/real-time/marti/2005_EIGHTEEN/webManager
8:15 AM
8:20 AM
8:45 AM
But, still found by Dezoëte, there is something much crazier and even more incomprehensible. The infrared monitoring of the zone on September 24, 2005, shows the appearance of two very pronounced thermal traces, which could in no way appear as signs of a natural phenomenon. So, burned by the destruction caused by Katrina, did the Americans do everything possible to control and weaken Rita?
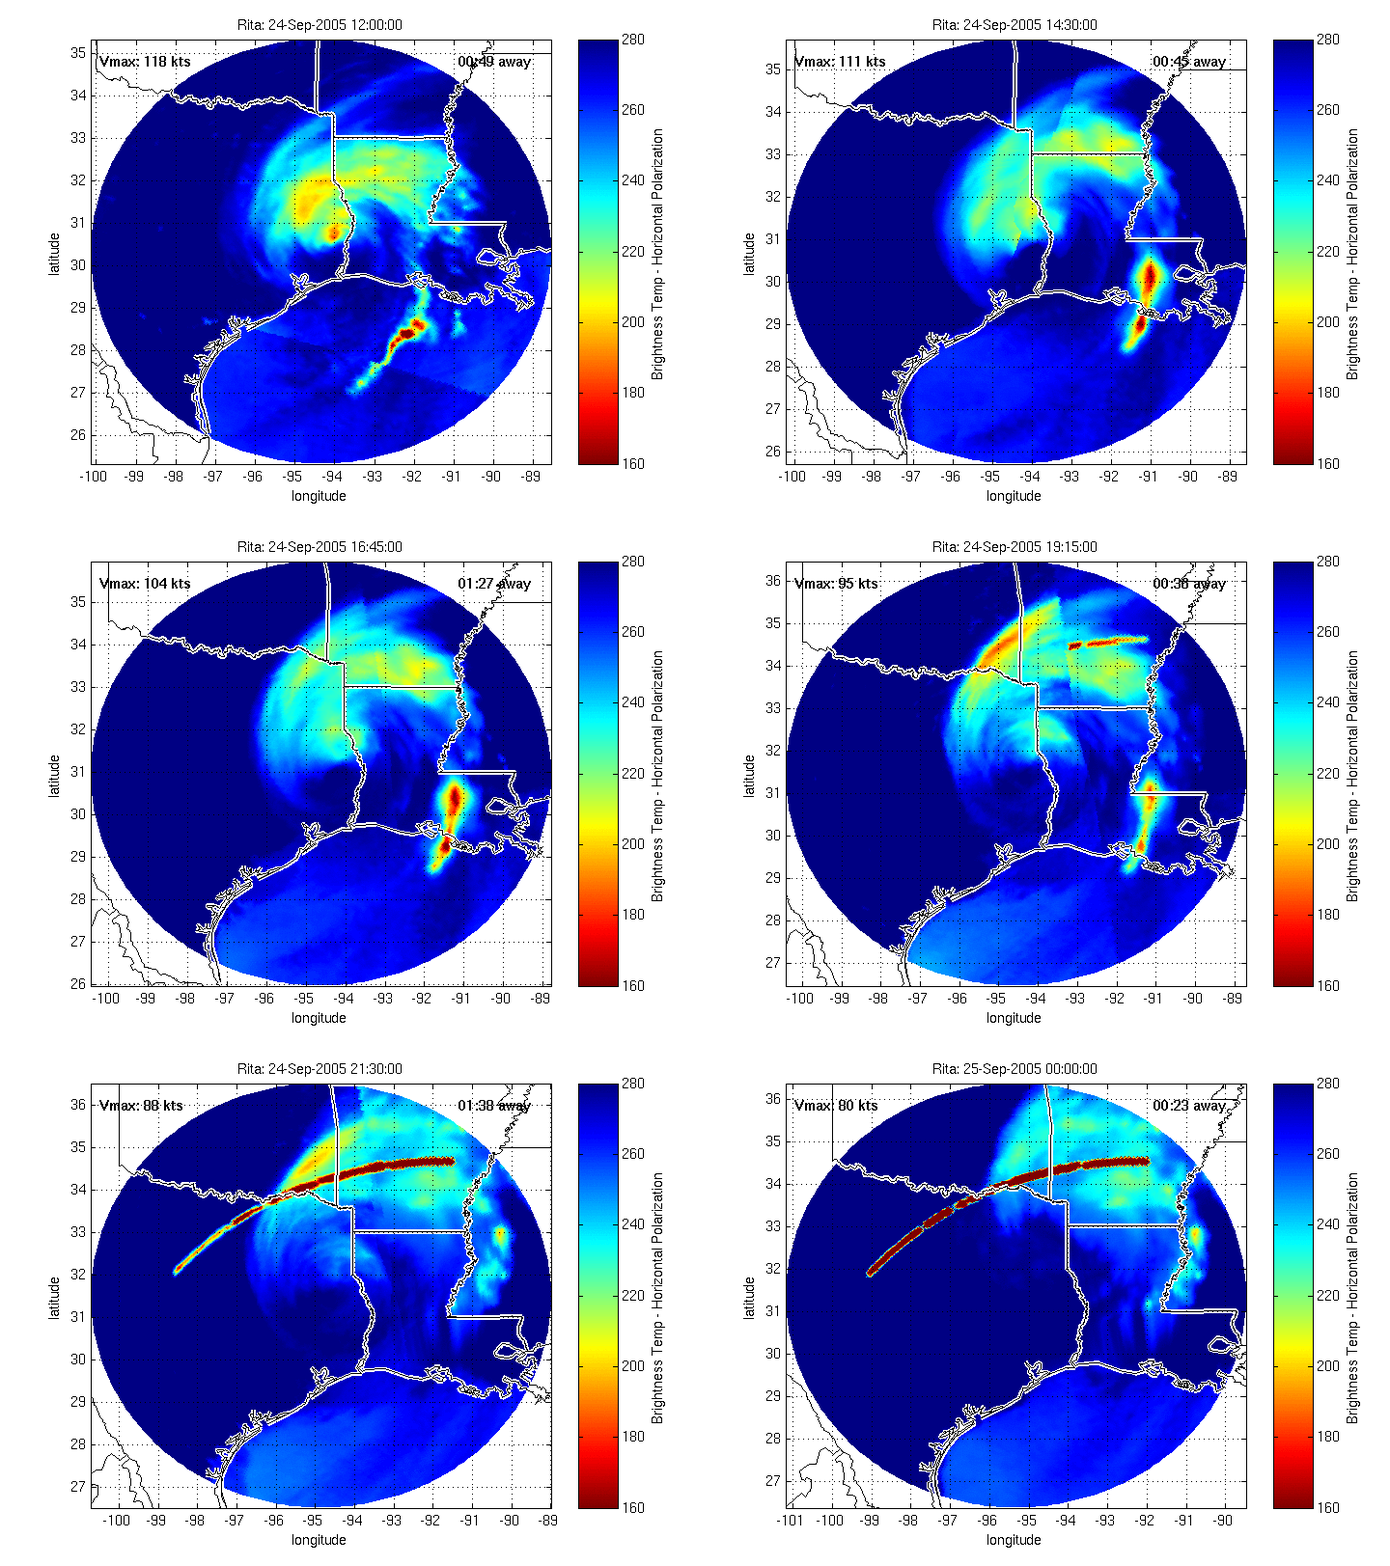

Strange thermal formations appear around Cyclone Rita, progressing in the southern United States
As in Ionesco's The Bald Soprano:
- How strange, how odd, and what a coincidence!
October 23, 2005: The University of Wisconsin, which was responsible for analyzing the images provided by the meteorological satellite, "provided an explanation" regarding the strange marks that had suddenly appeared in the images related to Cyclone Rita. According to these people, it would be "problems related to the decoding algorithm used." Note in passing one thing: the disturbance signaled by these "bear claws" nevertheless has its counterpart in the recordings made in the visible spectrum. Case to follow.
October 16, 2005. September the hottest month in a century.
AFP 14.10.05 \
23:59
September was the hottest month ever recorded on the planet
since temperatures have been scientifically measured in 1880,
announced Friday the US National Oceanic and Atmospheric
Administration (NOAA).
The average temperature was 0.63 degrees Celsius above average, according to a NOAA press release published on its website. It was the second warmest month since September 2003, when the average temperature had been 0.57 Celsius above average.
In the United States, September 2005 was only the fourth warmest month since 1880, with an average temperature 1.4 degrees Celsius above average. Louisiana, hit by Cyclone Katrina on August 29, had its warmest September in 111 years, and 27 other US states also recorded record average temperatures that same
month.
On September 28, the US National Snow and Ice Data Center (NSIDC), had announced a significant reduction in the Arctic ice cap
during the summer of 2005, for the fourth consecutive summer, a phenomenon attributed to climate warming.
"Given the record low ice levels this year approaching the end of September, 2005 will almost certainly surpass 2002 for the lowest Arctic ice extent in more than a century," said Julienne Stroeve, one of the NSIDC scientists.
These observations and measurements are made using NASA satellites, the US space agency.
"At this rate, the Arctic will be ice-free during the summer season well before the end of this century," she added.
Significant reduction in Arctic ice cap for the 4th consecutive summer
WASHINGTON (AFP) - The Arctic ice cap shrank significantly this year, for the fourth consecutive summer, American scientists said Wednesday, noting that this phenomenon, attributed to climate warming, will likely accelerate. "Given the record low ice levels this year approaching the end of September, 2005 will almost certainly surpass 2002 for the lowest Arctic ice extent in more than a century," said Julienne Stroeve of the National Snow and Ice Data Center (NSIDC). These observations and measurements are made using NASA satellites, the US space agency.
"At this rate, the Arctic will be ice-free during the summer season well before the end of this century," she added.
The frozen area of the Arctic Ocean normally shrinks to its minimum in September, at the end of the summer melt. On September 21, 2005, the sea ice was only 5.32 million km2, the lowest extent ever measured by observation satellites, scientists said in a statement.
"With four consecutive years of low Arctic ice extent, we can think with fairly high certainty that a sustained melting phenomenon is occurring," explained Walt Meier, another NSIDC climatologist. "This clearly indicates (...) that it is not a short-term anomaly," he added. NSIDC experts calculated, incorporating the latest September 2005 measurements, that the Arctic ice cap is shrinking by about 8% every ten years.
They also found that there was about 20% less ice formation during winter over the last four years compared to the 1978-2000 period.
This reduction in the frozen area of the Arctic Ocean represents approximately 1.3 million km2, roughly equivalent to twice the size of France.
The growing disappearance of Arctic ice corresponds to rising temperatures over recent decades, the NSIDC emphasized.
The average temperature at the surface of the Arctic Ocean between January and August 2005 was 2 to 3 degrees Celsius warmer than over the last fifty years.
This summer, the legendary Northwest Passage in the Canadian Arctic between Europe and Asia was completely navigable except for a 90 km band where ice blocks floated. The Northern Sea Route, north of the Siberian coast, was completely ice-free from August 15 to September 28, NSIDC scientists also noted.
s ---
Back to Guide Back to Home Page
Number of views of this page since October 16, 2005: