Matter ghost matter astrophysics.6:
Spiral structure.(p9)
- Interaction regimes.
Our simulation program computes
the momentum of the cluster for each step. As shown on figure 14, this momentum
decreases during the first ten turns. We observed that a stable momentum plateau
is reached when the dynamical friction becomes neglectible and the tidal effect
predominant.
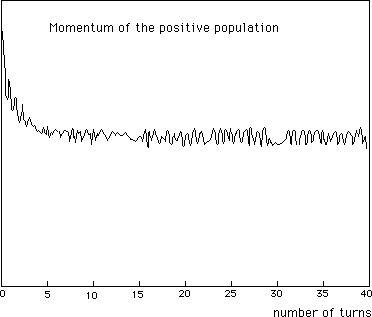
Fig.14: Evolution of
the momentum of the
positive mass cluster, versus
the number of turns.
In the same time, the negative
masses halo forms its own clusters, by gravitational instability and resonance
process, and the central positive mass cluster forms arms, due to tidal forces.
Such tidal effects tend to slow down the rotation of the central cluster,
but less efficiently than close contact dynamical friction effect observed
at the beginning of the process. On the figure 13-f we show the typical aspect
of the negative mass clusterized halo (but, as pointed out above, this clusterization
is not a relevant phenomenon).

.
Fig. 15 : Ten turns.
The halo of negative material
with its clusters.
- Fourier analysis
The previous results comes from
the experience. Our eyes are the best tools to identify spiral structure.
However, F. Lansheat has computed a spatial Fourier tranformation on the cluster
which shows clearly a signal. The transformation is first applied on a radius
of the cluster. It is the summed over 360 degres. Three spatial spectrums
are shown on figure 16. The spatial frequency is here expressed versus the
inverse of the number of pixels. A one pixel value is the minimum distance
in our calulation sheet.
Figure 16 (top) : This is the
cluser at time 0 has been given to the positive population. The halo has the
shape given by the 2-d Eddington equations. The peak corresponds to the mean
cluster radius, which is here 1/0.05 = 20 pixels.
Figure 16 (middle): After two
turns, the dynamic friction creates the fisrt irregularities. Their size is
quite small. The top of the peak is here 0.2 pixel-1. This is 5 pixels wide.
Figure 16 (bottom): The tidal
effect is now mostly acting. The peak of the spatial spectrum sits at 0.12.
This corresponds to an approximate size of 8 pixels. This spectrum will remain
over the rest of the calculation.

Fig. 16 : Spatial Fourier
transformation of the cluster.
This shows clealry the appearance
of arm structures.